Difference between revisions of "Display2"

From EosPedia
Jump to: navigation, search
(Edit Menu)
(Operationメニュー)
Line 566: Line 566:
 
<br>
 
<br>
  
===Operationメニュー===
+
===Operation Menu===
 
<table>  
 
<table>  
 
<tr>  
 
<tr>  
Line 572: Line 572:
 
<td><p align="left">fft2d<br></p>  
 
<td><p align="left">fft2d<br></p>  
 
</td>  
 
</td>  
<td><p align="left">FFT処理を行う<br></p>  
+
<td><p align="left">Perform FFT<br></p>  
 
</td>  
 
</td>  
 
</tr>  
 
</tr>  

Revision as of 07:49, 20 August 2014

Display2 is the Command for image display on Eos. It can also cut out ROI(Region of Interest) from image. In addition, it can display Fourier transform image. And, in the case of 3D data, it can display its section.

List of option

Main option

Option Essential/Optional Description Default
-i Optional Input: mrcImage NULL
-t Optional Template for InputFile 85.roi
-o Optional Logfile .EosLog
-L Optional LowThreshold 0.0(if not set, not use.)
-H Optional HighThreshold 0.0(if not set, not use.)
-Zoom Optional Zoom for InputFile 1.0
-Inverse Optional Inverse (HighValue(dark)<->LowValue(bright)) for InputFile
-display Optional :0.0
-geometry Optional Initial size and position of window. 1024x1024+0+0
-c Optional ConfigurationFile NULL
-m Optional Mode 0
-h Optional Help  
If not set -L or -H, estimate contrast at centre 64x64 image.


-m details

Value Description
0


-geometry 's argument format

-geometry (Size x)x(Size y)+(Position x)+(Position y)
Either Size or Position don't have to set.


Execution example

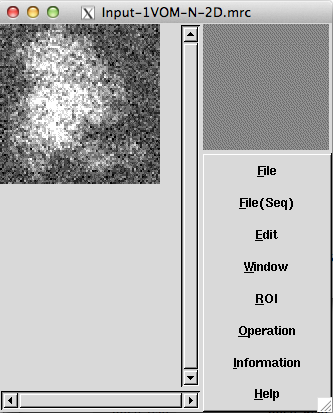
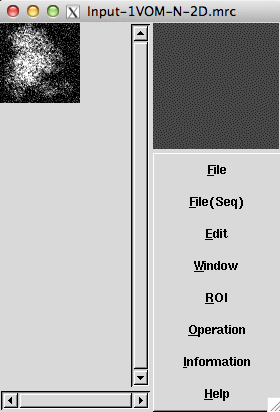
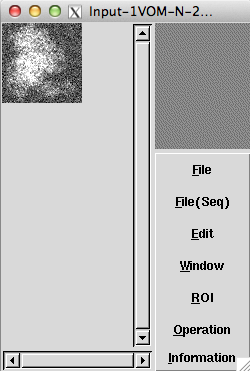
Input file image

Input-1VOM-N-2D.png

Min

Max
Mean
SD

SE

-18651.7 (10, 1, 0)

52942.7 (24, 39, 0)
7214.87
10067.6

125.845


Case: Options only essential

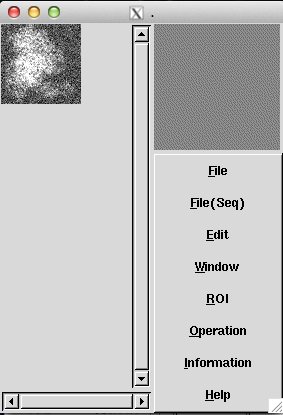
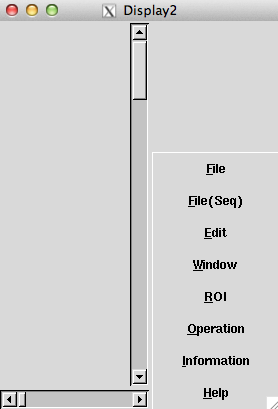
Outdata-Display2.png

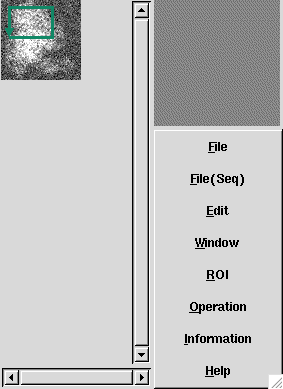
File

File(Seq)
Edit
Window
ROI
Operation
Information

Help

file operation

Seq file operation
Edit
Window operation
ROI file creation
Image Process
Information display

Help


Option -L, -H

Case: L=0, H=30000

Set -L, -H about image, then it can display at wished range.

Outdata-LH-Display2.png

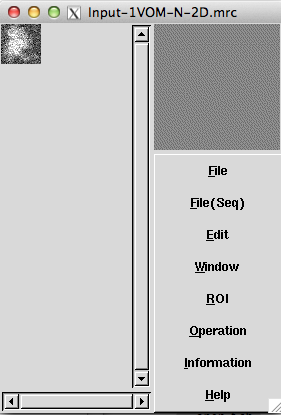
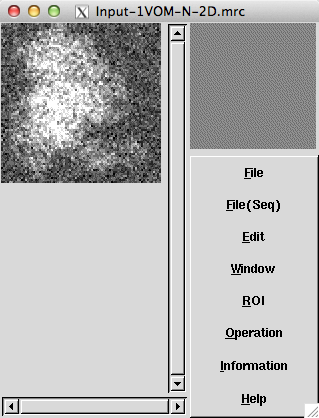
Option -Zoom

Case: Zoom=2

Outdata-Zoom-Display2.png

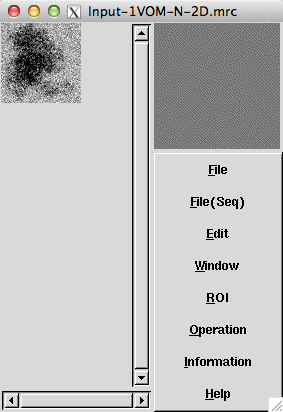
Option -Inverse

Outdata-Inverse-Display2.png

Option -geometry

Case: geometry=250x350+100+100

The following window is shown right bottom than default.

Outdata-geometry-Display2.png

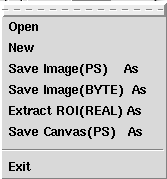
File Menu

Outdata-File-Display2.png

Open

New
Save Image(PS) As
Save Image(BYTE) As
Extract ROI(REAL) As
Save Canvas(PS) As

Exit

Open the file at same window.

Open the file at new window.
Save as PS file.
Save as file. (Not implemented)
Extract as ROI file
Save image as PS file

Exit


Open


New


Save Image(PS) As


Save Image(BYTE) As


Extract ROI(REAL) As

Output as ROI file by setting range and size.


Save Canvas(PS) As

Save PS file as the following.

Outdata-File1-Display2.png

File(Seq) Menu

Outdata-File(Seq)-Display2.png

Open
New

Open the file at same window.
Open the file at new window.


Open


New


Edit Menu

Outdata-Edit-Display2.png

Cancel

OK
Move
Resize
Rotate
All Delete
Delete
ZoomIn
ZoomOut

ROIInfo

Cancel the cut out region.

Determine the cut out region.(MultiShape only)
Move the cut out region.
Resize of the cut out region.
Rotate the cut out region.
Delete all cut out region.(MultiShape only)
Delete one cut out region.(MultiShape only)
Zoom in
Zoom out

Open ROI Information Window


Cancle

Cancel the cut out region.
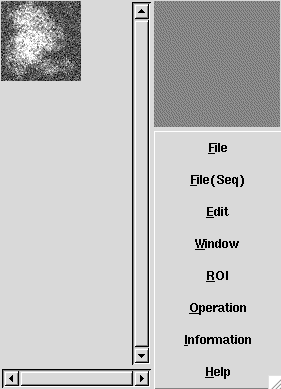
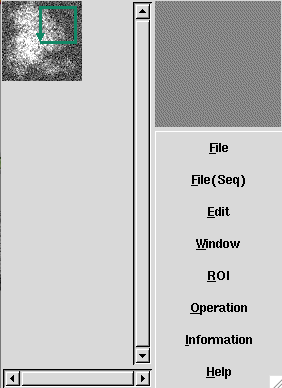
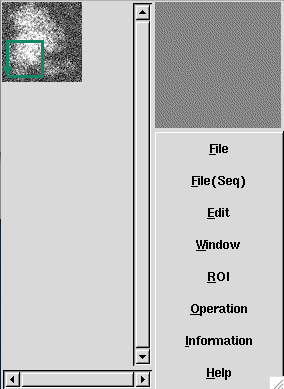
Outdata1-Display2.png -> Outdata-Cancle-Display2.png


OK

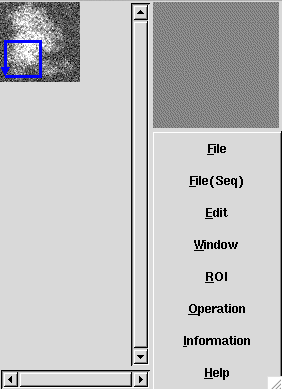
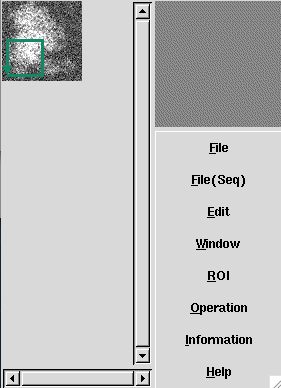
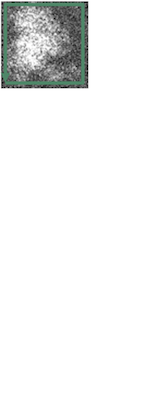
Determine the cut out region. (Before: Blue, After: Green)
Outdata-OK-Display2.png -> Outdata1-OK-Display2.png


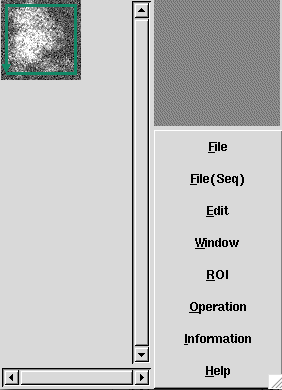
Move

Move by dragging.
Outdata1-Display2.png -> Outdata-Move-Display2.png


Resize

Resize by dragging.
Outdata1-Display2.png -> Outdata-Resize-Display2.png


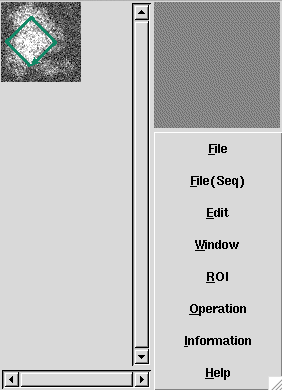
Rotate

Rotate by dragging.
Outdata1-Display2.png -> Outdata-Rotate-Display2.png


All Delete

Delete all cut out region.
Outdata3-ROIInfo-Display2.png -> Outdata1-AllDelete-Display2.png


Delete

Delete the Current cut out region.
Outdata2-Display2.png -> Outdata-Delete-Display2.png
Outdata3-ROIInfo-Display2.png -> Outdata1-Delete-Display2.png


ZoomIn

Zoom in at range: 1/n <-> origin <-> n times
Outdata-Display2.png -> Outdata-ZoomIn-Display2.png


ZoomOut

Zoom out at range: 1/n <-> origin <-> n times
Outdata-Display2.png -> Outdata-ZoomOut-Display2.png


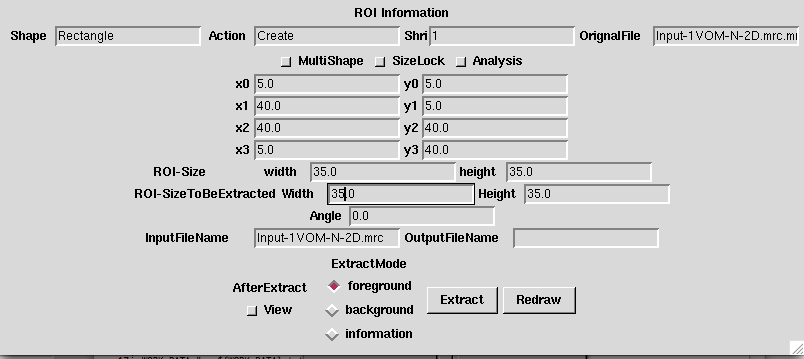
ROIInfo

Set and Output ROI file.
Case: Rectrangle

Outdata-ROIInfo-Display2.png

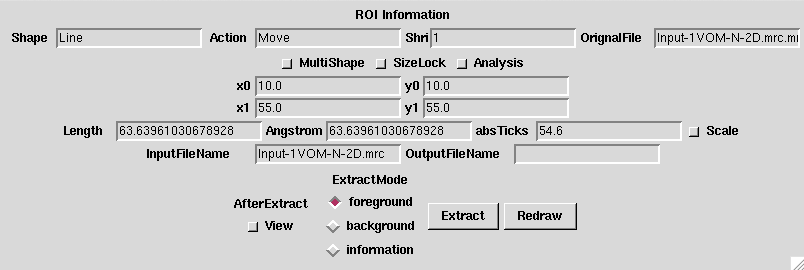
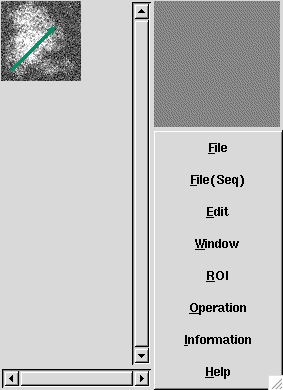
Case: Line

Outdata1-Line-Display2.png

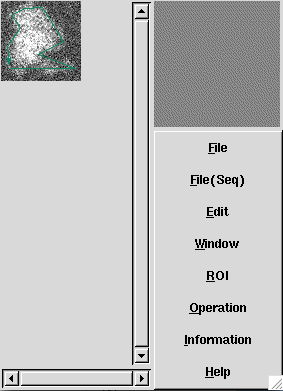
Case: Spline

Outdata1-Spline-Display2.png

Extract
Extract ROI file


AfterExtract
If you check View, open the new window of output ROI file after extract.(foreground only)
Outdata-AfterExtract-Display2.png -> Outdata1-AfterExtract-Display2.png


Redraw


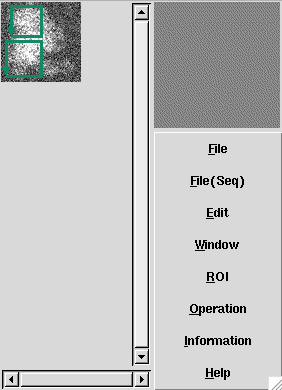
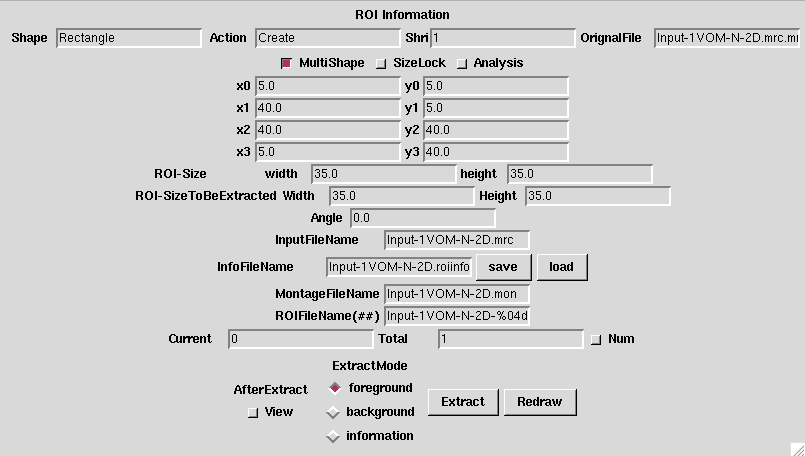
MultiShape
It can output multiple ROI files, and displays the MultiShape option.

Outdata1-ROIInfo-Display2.png

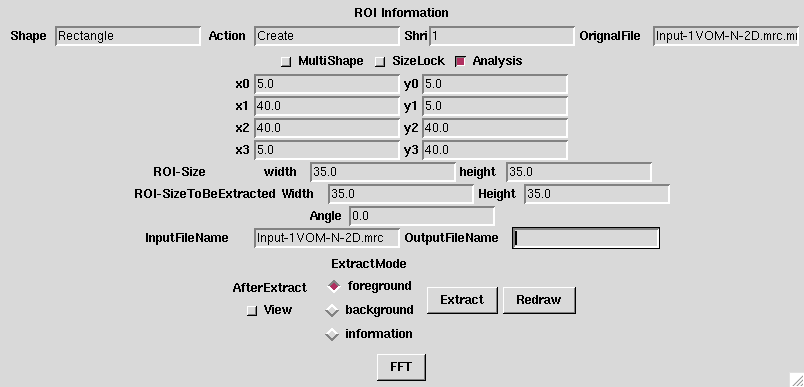
If you check Analysis, displays the FFT button.

Outdata2-ROIInfo-Display2.png

Window Menu

Outdata-Window-Display2.png

New Wondow

Open new window.


New Window

Outdata1-Window-Display2.png

ROI Menu

Outdata-ROI-Display2.png

Rectangle

Line
Spline
Create
Select
ZoomIn
ZoomOut
MultiROI
SizeLock

ROIInfo

Rectangle is cut out region.

Line is cut out region.
Spline is cut out region.
Create new cut out region.
Select a cut out region.(MultiShape only)
Zoom in
Zoom out
Cut out multiple ROI files

View ROI Information


Rectangle

Rectangle is cut out region.

Outdata1-Display2.png

Cut out image
Outdata-Extract-Display2.png

Min

Max
Mean
SD

SE

-10973.5 (23, 0, 0)

52942.7 (19, 34, 0)
12818.1
10974.8

304.857


-o 's Log data
mrcImageROI -i Input-1VOM-N-2D.mrc -o Outdata.mrc -m 2 -r 5.0 5.0 40.0 5.0 40.0 40.0 5.0 40.0


Line

Line is cut out region.

Outdata-Line-Display2.png

Spline

Spline is cut out region.

Outdata-Spline-Display2.png

Cut out image
Outdata2-Spline-Display2.png

Min

Max
Mean
SD

SE

-18651.7 (51, 1, 0)

52942.7 (12, 7, 0)
8339.4
10634.9

73.3183br>


-o 's Log data
mrcImageUnbentROI -i Input-1VOM-N-2D.mrc -o Outdata.mrc -x 80 -r 9.0 12.0  74.0 12.0  37.0 26.0  62.0 39.0  41.0 73.0  23.0 72.0  10.0 65.0  19.0 53.0  6.0 34.0  8.0 14.0 


Create
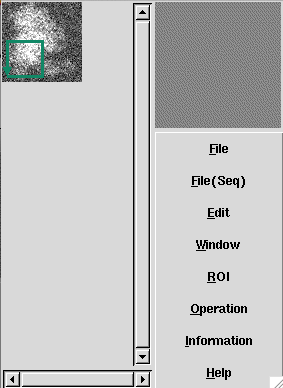
Create new cut out region.
Outdata1-Display2.png -> Outdata-Create-Display2.png


ZoomIn

Same as Edit Menu


ZoomOut

Same as Edit Menu


MultiROI

It can cut out multiple ROI files


SizeLock


ROIInfo

Same as Edit Menu

Operation Menu

Outdata-Operation-Display2.png

fft2d

Perform FFT


fft2d


Informationメニュー

画像上にて右クリックすることでも同様のメニューを開くことができる
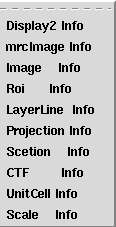
Outdata-Information-Display2.png

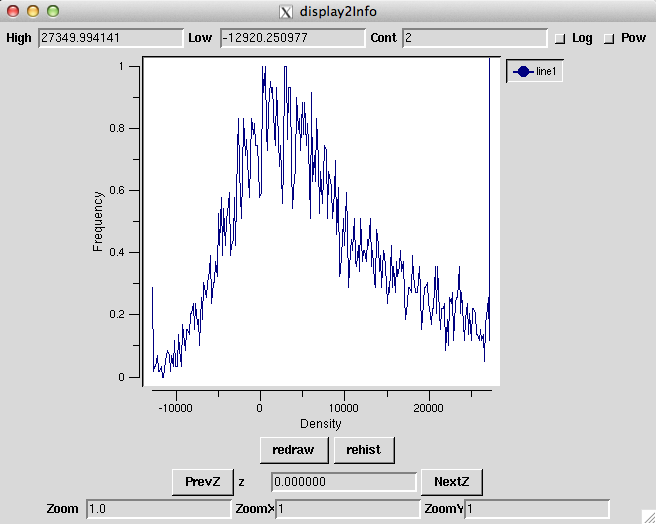
Display2 Info

mrcImage Info
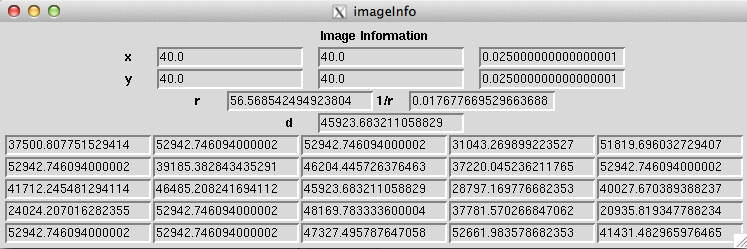
Image Info
Roi Info
LayerLine Info
Projection Info
Section Info
CTF Info
UnitCell Info

Scale Info

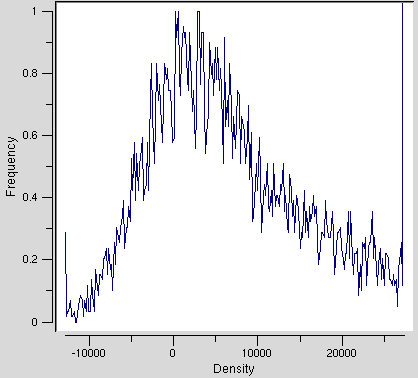
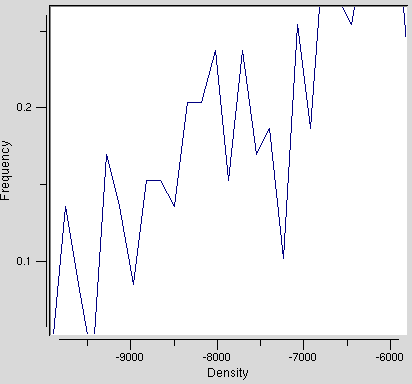
密度とFrequencyのグラフを表示する


Display2 Info

Outdata1-Information-Display2.png

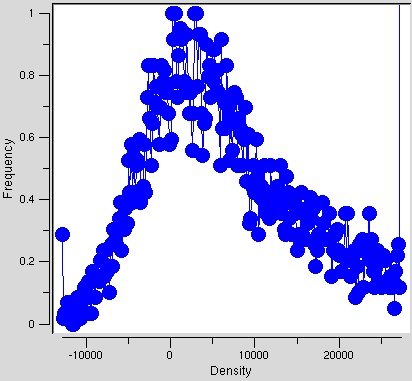
右上のボタン(line1)を押すと、グラフのピークが表示される
Outdata-Display2Info-Display2.png -> Outdata1-Display2Info-Display2.png


グラフ上をドラッグすることでズームができる(連続操作可能)
Outdata-Display2Info-Display2.png -> Outdata2-Display2Info-Display2.png


グラフ上を右クリックすると、ズームを1段階戻す
Outdata2-Display2Info-Display2.png -> Outdata-Display2Info-Display2.png


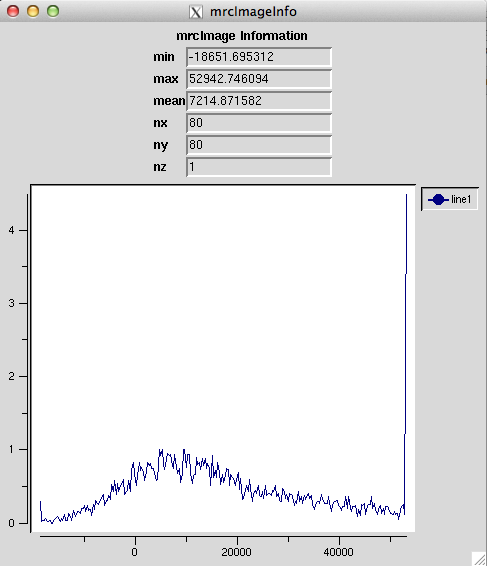
mrcImage Info

mrcImage's image情報が表示される

Outdata2-Information-Display2.png

Display2 Infoと同様にグラフのピークの表示やズームができる


Image Info

クリックした箇所のdataが得られる

Outdata4-Information-Display2.png

Roi Info

Editメニューと同様

LayerLine Info


Projection Info


Scetion Info


CTF Info


UnitCell Info

Outdata3-Information-Display2.png

Scale Info


Helpメニュー

Outdata-Help-Display2.png

Help

Help