「pdbRhoFit」の版間の差分
| 行437: | 行437: | ||
423.41<br> | 423.41<br> | ||
4.84285<br></p> | 4.84285<br></p> | ||
| + | </td> | ||
| + | </tr> | ||
| + | </table> | ||
| + | |||
| + | ===オプション -phimin, -phimax, -phid=== | ||
| + | ====phimin=0, phimax=360, phid=3, C=1で実行==== | ||
| + | =====pdbの画像===== | ||
| + | <table> | ||
| + | <tr> | ||
| + | <td>[[画像:Outdata(pdb)-phiminphimaxphid-pdbRhoFit.png]]</td> | ||
| + | <td><p align="left">重心<br> | ||
| + | 最大半径<br> | ||
| + | 最大半径(座標)<br> </p> | ||
| + | </td> | ||
| + | <td><p align="left">1.727132e+01 1.572633e+02 9.389075e+01<br> | ||
| + | 3.286635e+01<br> | ||
| + | 23.50 26.28 28.04<br></p> | ||
| + | </td> | ||
| + | </tr> | ||
| + | </table> | ||
| + | |||
| + | =====[[mrcImage]]の画像===== | ||
| + | <table> | ||
| + | <tr> | ||
| + | <td>[[画像:Outdata(mrc)-phiminphimaxphid-pdbRhoFit.png]]</td> | ||
| + | <td><p align="left">最小<br> | ||
| + | 最大<br> | ||
| + | 平均値<br> | ||
| + | 標準偏差<br> | ||
| + | 標準誤差<br></p> | ||
| + | </td> | ||
| + | <td><p align="left">0 (0, 0, 0)<br> | ||
| + | 1465 (62, 15, 0)<br> | ||
| + | 210<br> | ||
| + | 387.626<br> | ||
| + | 2.23316<br></p> | ||
| + | </td> | ||
| + | </tr> | ||
| + | </table> | ||
| + | |||
| + | ===オプション -psimin, -psimax, psid=== | ||
| + | ====psimin=30, psimax=60, psid=1, C=1で実行==== | ||
| + | =====pdbの画像===== | ||
| + | <table> | ||
| + | <tr> | ||
| + | <td>[[画像:Outdata(pdb)-psiminpsimaxpsid-pdbRhoFit.png]]</td> | ||
| + | <td><p align="left">重心<br> | ||
| + | 最大半径<br> | ||
| + | 最大半径(座標)<br> </p> | ||
| + | </td> | ||
| + | <td><p align="left">6.009141e+01 1.475229e+02 6.392447e+01<br> | ||
| + | 3.286696e+01<br> | ||
| + | 26.05 23.76 29.27<br></p> | ||
| + | </td> | ||
| + | </tr> | ||
| + | </table> | ||
| + | |||
| + | =====[[mrcImage]]の画像===== | ||
| + | <table> | ||
| + | <tr> | ||
| + | <td>[[画像:Outdata(mrc)-psiminpsimaxpsid-pdbRhoFit.png]]</td> | ||
| + | <td><p align="left">最小<br> | ||
| + | 最大<br> | ||
| + | 平均値<br> | ||
| + | 標準偏差<br> | ||
| + | 標準誤差<br></p> | ||
| + | </td> | ||
| + | <td><p align="left">0 (66, 0, 0)<br> | ||
| + | 1550 (54, 41, 0)<br> | ||
| + | 269.644<br> | ||
| + | 502.548<br> | ||
| + | 3.2171<br></p> | ||
| + | </td> | ||
| + | </tr> | ||
| + | </table> | ||
| + | |||
| + | ===オプション -thetamin, -thetamax, -thetad=== | ||
| + | ====thetamin=90, thetamax=180, thetad=30, C=1で実行==== | ||
| + | =====pdbの画像===== | ||
| + | <table> | ||
| + | <tr> | ||
| + | <td>[[画像:Outdata(pdb)-thetaminthetamaxthetad-pdbRhoFit.png]]</td> | ||
| + | <td><p align="left">重心<br> | ||
| + | 最大半径<br> | ||
| + | 最大半径(座標)<br> </p> | ||
| + | </td> | ||
| + | <td><p align="left">1.475229e+02 1.581092e+02 9.018824e+01<br> | ||
| + | 3.286666e+01<br> | ||
| + | 23.76 28.04 25.30<br></p> | ||
| + | </td> | ||
| + | </tr> | ||
| + | </table> | ||
| + | |||
| + | =====[[mrcImage]]の画像===== | ||
| + | <table> | ||
| + | <tr> | ||
| + | <td>[[画像:Outdata(mrc)-thetaminthetamaxthetad-pdbRhoFit.png]]</td> | ||
| + | <td><p align="left">最小<br> | ||
| + | 最大<br> | ||
| + | 平均値<br> | ||
| + | 標準偏差<br> | ||
| + | 標準誤差<br></p> | ||
| + | </td> | ||
| + | <td><p align="left">0 (96, 36, 0)<br> | ||
| + | 1412 (6, 11, 0)<br> | ||
| + | 285.358<br> | ||
| + | 511.536<br> | ||
| + | 3.27464<br></p> | ||
</td> | </td> | ||
</tr> | </tr> | ||
</table> | </table> | ||
2013年11月12日 (火) 00:12時点における版
目次
オプション一覧
メインオプション
| オプション | 必須項目/選択項目 | 説明 | デフォルト |
|---|---|---|---|
| -ipdb | 必須 | 入力ファイル: [pdb] (原子モデル) | NULL |
| -imrc | 必須 | 入力ファイル: mrcImage | NULL |
| -omrc | 必須 | 出力ファイル: mrcImage | NULL |
| -otxt | 選択 | 出力ファイル: [テキスト] | NULL |
| -opar | 選択 | 出力ファイル: [パラメータ] | stdout |
| -opdb | 選択 | 出力ファイル: [pdb] | NULL |
| -xmin | 選択 | xの最小 | 0 |
| -xmax | 選択 | xの最大 | 0 |
| -xd | 選択 | xの間隔 | 1 |
| -ymin | 選択 | yの最小 | 0 |
| -ymax | 選択 | yの最大 | 0 |
| -yd | 選択 | yの間隔 | 1 |
| -zmin | 選択 | zの最小 | 0 |
| -zmax | 選択 | zの最大 | 82 |
| -zd | 選択 | zの間隔 | 1 |
| -EA | 選択 | Euler Angle for three-angle | ZOYS |
| -phimin | 選択 | phiの最小: [degree] | 0 |
| -phimax | 選択 | phiの最大: [degree] | 194 |
| -phid | 選択 | phiの間隔: [degree] | 2 |
| -psimin | 選択 | psiの最小: [degree] | 0 |
| -psimax | 選択 | psiの最大: [degree] | 0 |
| -psid | 選択 | psiの間隔: [degree] | 2 |
| -thetamin | 選択 | thetaの最小: [degree] | 0 |
| -thetamax | 選択 | thetaの最大: [degree] | 0 |
| -thetad | 選択 | thetaの間隔: [degree] | 2 |
| -nw | 選択 | weight for normalize | 100000000.0 |
| -nC | 選択 | weight for normalize | 0.0 |
| -I | 選択 | 黒を高密度とする | |
| -Zminus | 選択 | Shift to -z | |
| -Tlim | 選択 | The atom will be neglected | 60 |
| -Centre | 選択 | Filament-axis is x=0, y=0 | |
| -C | Variable | ContourLevel | 0.0 |
| -c | 選択 | コンフィグファイル設定 | NULL |
| -m | 選択 | モードを設定 | 0 |
| -h | 選択 | ヘルプを表示 |
    -ipdb   : Filename of pdb file of atomic model
    -imrc   : Filename of mrc file of contour map
    -omrc   : Filename of mrc file of fitting results
    -otxt   : Filename of text file of fitting results
    -opar   : Filename of text file of fitting results
    -opdb   : Filename of pdb file with a max score after fitting results
    -zmin   : Initial value of z (should <= zmax)
    -zmax   : Final value of z
    -zd     : Delta z for fitting (should >0)
    -phimin : Initial value of phi (should <= phimax; initial value of phi is 0)
    -phimax : Final value of phi (should >0)
    -phid   : Delta phi for fitting (should >0)
    -C      : Contour level (variable and MUST be last option)
    -Inverse: Protein has high density on the image
    -Zminus : Atomic model shift to -z while fitting
    -Tfactor: Consider temperature factor
    -Tlim   : The atoms whose T factor is above Tlim will be neglected
    -Centre : Filament-axis is x=0, y=0
モードの詳細
| モード | 説明 |
|---|---|
| 0 | 輪郭内の原子をカウントする |
| 1 | 原子の密度を加える |
実行例
入力ファイルの画像
pdbの画像
 |
重心 最大半径 |
6.053012e+00 2.519590e+01 1.189075e+01 3.286664e+01 |
mrcImageの画像
 |
最小 最大 |
0 (0, 0, 0) 5 (34, 41, 36) |
オプション -C
C=1で実行
pdbの画像
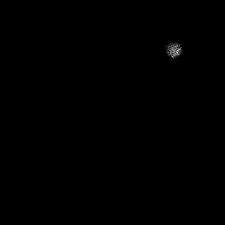 |
重心 最大半径 |
1.548556e+02 1.552094e+02 9.389075e+01 3.286630e+01 |
mrcImageの画像
 |
最小 最大 |
0 (0, 0, 0) 1484 (94, 15, 0) |
オプション -xmin, -xmax, xd
xmin=0, xmax=10, xd=1, C=1で実行
pdbの画像
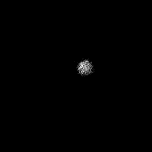 |
重心 最大半径 |
2.041704e+01 1.983455e+01 9.389075e+01 3.286621e+01 |
mrcImageの画像
 |
最小 最大 |
0 (1, 0, 1) 1547 (1, 43, 0) |
オプション -ymin, -ymax, -yd
ymin=10, ymax=20, yd=2, C=1で実行
pdbの画像
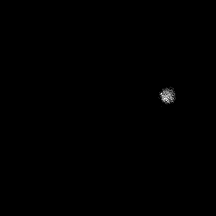 |
重心 最大半径 |
1.475229e+02 2.818824e+01 9.389075e+01 3.286666e+01 |
mrcImageの画像
 |
最小 最大 |
0 (1, 0, 1) 1550 (44, 24, 0) |
オプション -zmin, -zmax, -zd
zmin=20, zmax=70, zd=2, C=1で実行
pdbの画像
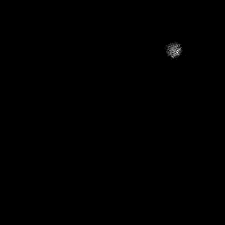 |
重心 最大半径 |
1.548556e+02 1.552094e+02 8.189075e+01 3.286630e+01 |
mrcImageの画像
最小 最大 |
0 (1, 0, 1) 1484 (94, 0, 0) |
オプション -phimin, -phimax, -phid
phimin=0, phimax=360, phid=3, C=1で実行
pdbの画像
 |
重心 最大半径 |
1.727132e+01 1.572633e+02 9.389075e+01 3.286635e+01 |
mrcImageの画像
 |
最小 最大 |
0 (0, 0, 0) 1465 (62, 15, 0) |
オプション -psimin, -psimax, psid
psimin=30, psimax=60, psid=1, C=1で実行
pdbの画像
 |
重心 最大半径 |
6.009141e+01 1.475229e+02 6.392447e+01 3.286696e+01 |
mrcImageの画像
 |
最小 最大 |
0 (66, 0, 0) 1550 (54, 41, 0) |
オプション -thetamin, -thetamax, -thetad
thetamin=90, thetamax=180, thetad=30, C=1で実行
pdbの画像
 |
重心 最大半径 |
1.475229e+02 1.581092e+02 9.018824e+01 3.286666e+01 |
mrcImageの画像
 |
最小 最大 |
0 (96, 36, 0) 1412 (6, 11, 0) |