Single particle analysis
The Single Particle Analysis(SPA) is, in Japanese, 単粒子解析法. Single Particle Analysis is the image analysis in two or three dimensions of a particle (or object), based on the assumption that it has an identical shape in either two or three dimensions ( all images of a particle are assumed to present its own identical shape).
Contents
2D Single Particle Analysis
2D Single Particle Analysis does the following, 1) to classify the two dimensional electron microscopic images, which are essentially the projected images, 2) to average them, and 3) to discuss the obtained structural information.
Cluster Analysis
We classify the electron microscopic images, initially by 1) grouping them according to their similarity, and 2) making a hierarchy structure of the image similarity. Averaging of the similar images in a group can enhance the SN ratio of the averaged image. The averaged image is used as a reference for determining the orientation of individual image (included in the input file for the calculation), or as a reference for determining the orientation of the particle.
Example 1 (Preprocessing ~ Classification)
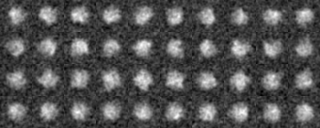
Preprocessing
command2: mrcImageLowPassFilter -i XXX.prelow -o XXX.preshrink -m 4 -hvp 0.1
Cluster Analysis
This command classifies the images using mrcImageAutoRotationCorrelation which calculates correlation of the images.
         1          0         40         40         99.2851
         2          0         40         40         90.0657
         2          1         40         40         75.2851
         3          0         40         40         82.6412
         3          1         40         40         87.9777

-snip-

         3          2          3          2         442.652
         1          0          3          0         373.403
         2          0          3          0         630.906
         2          1          3          0         349.983
         1          0          2          1         562.309
Classification
-OL Input-Cluster.padsortlst -AL Input-Cluster.avesortlst 0 avg -OT Outdata-Cluster.treeinfo
121p-shift-rot000.mrc-rot000.pad 0 590.000000 83.277847
121p-shift-rot000.mrc-rot090.pad 3 580.000000 83.277847
121p-shift-rot000.mrc-rot030.pad 1 570.000000 87.326599
121p-shift-rot000.mrc-rot060.pad 2 560.000000 87.326599
121p-shift-rot000.mrc-rot120.pad 4 550.000000 79.850204

-snap-

121p-shift-rot045.mrc-rot000.pad 10 240.000000 80.898613
121p-shift-rot045.mrc-rot270.pad 19 230.000000 80.898613
121p-shift-rot045.mrc-rot060.pad 12 220.000000 80.506714
121p-shift-rot045.mrc-rot240.pad 18 210.000000 78.504913
121p-shift-rot045.mrc-rot030.pad 11 200.000000 68.052155
121p-shift-rot000.mrc-rot000.pad.avg 0 590.000000 83.277847 0 0
121p-shift-rot000.mrc-rot090.pad.avg 3 580.000000 83.277847 0 0
121p-shift-rot000.mrc-rot030.pad.avg 1 570.000000 87.326599 0 0
121p-shift-rot000.mrc-rot060.pad.avg 2 560.000000 87.326599 0 0
121p-shift-rot000.mrc-rot120.pad.avg 4 550.000000 79.850204 0 0

-snip-

121p-shift-rot045.mrc-rot000.pad.avg 10 240.000000 80.898613 0 0
121p-shift-rot045.mrc-rot270.pad.avg 19 230.000000 80.898613 0 0
121p-shift-rot045.mrc-rot060.pad.avg 12 220.000000 80.506714 0 0
121p-shift-rot045.mrc-rot240.pad.avg 18 210.000000 78.504913 0 0
121p-shift-rot045.mrc-rot030.pad.avg 11 200.000000 68.052155 0 0
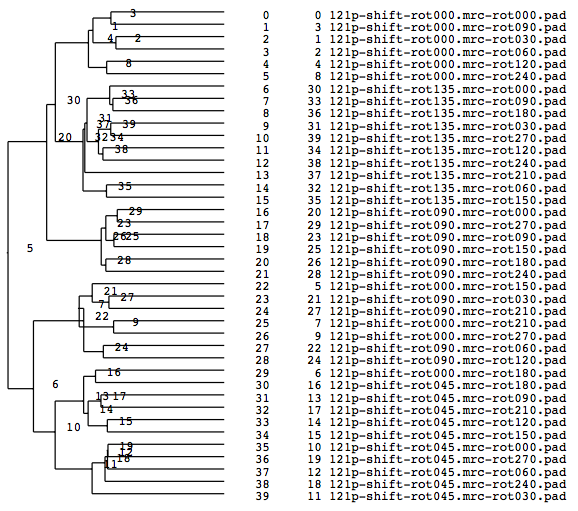
A tree diagram, the results of the cluster analysis, is output as a PS file.
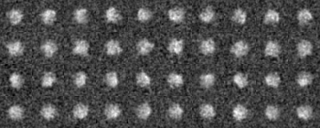
-OL The input images sorted by the cluster analysis(Ascending order in the tree: left bottom is No.0)
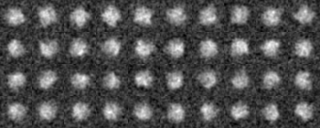
-AL The classified averaged images in the groups(Corresponding to the branch number in the tree:left bottom is No.0)
Input the following commands to execute a series of commands described so far. This uses input file and a Makefile.
make Init
make ALLROIS
make Pad
make Log
make LogPS
Example2(Use modified input images)
We analyze another data set input file(ROI) in the similar way.
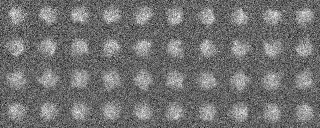
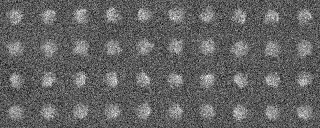
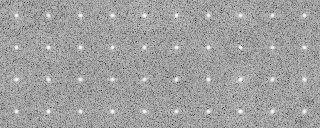
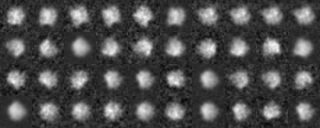
Those images were a modification of the previous images, by four different rotations along y axis (vertical), by ten different rotations along x axis (horizontal) and by noise addition with SN=0.9.
After preprocessing
A tree diagram obtained by the cluster analysis (PS file)
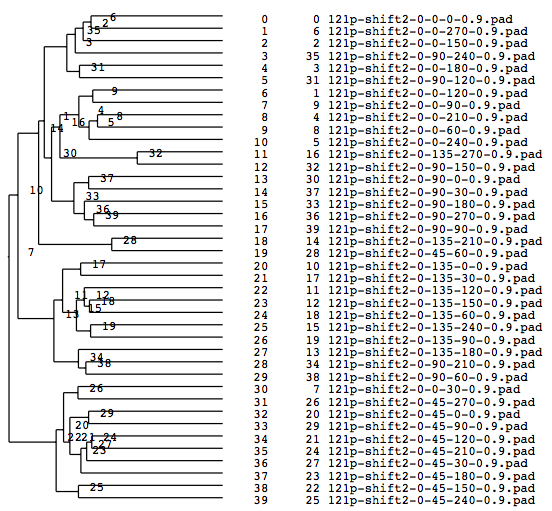
In the present analysis using mrcImageClusterAnalysis which calculates a correlation that takes rotations within the plane into account, the four groups which are different in the rotation angle along the y-axis should emerge in the results. However, in this actual case where noises are added, the obtained results are not perfect enough due to incomplete preprocessing. In the tree, there is a group consistng of only two elements (No.18, 19 in the tree No.28)があります。(File name: 121p-shift2-X軸回転-Y軸回転-面内回転-SN.pad)
Coincidence number (with the model) in the groups when grouped in four (y-axis rotation grouping)
group000022:	match:	9	owner:	45
group000013:	match:	8	owner:	135
group000028:	match:	0	owner:	0
group000001:	match:	8	owner:	90
				total:	25
parcentage:	0.625000
As some groups are two-membered, a coincidence number (with the model) is about 60%.
3D single particle analysis
3D single particle analysis is the following method: by assuming that each particle has the same structure although the projection angle is different, we can reconstruct 3D structure of the particle from each projection. The protocol was the below.
1. Extraction of particle 2D images.
- Pre-processing of EM Images (CTF correction, noise reduction, etc.) (ctfDisplay, etc.])
- Extraction fo particles from pre-processed images (Display2 etc.)
2. Preparation of an initial reference model.
- Preparation of some 3D as an initial reference model (mrcImageModelCreate, pdb2mrc etc.)
3. 3D reconstruction
- Generation of a set of 2D images projected from the reference 3D (mrc3Dto2D)
- Estimation of the projection angle of each particle image as the projection angle of the 2D reference image which has the highest correlation coefficient or something like similarity between both (mrcImageAutoRotationCorrelation)
- 3D reconstruction (mrc3Dto2D)
- Check of the validity or quality of 3D (mrcImageFourierShellCorrelation, mrcImageFOMCalc, etc.)
- Refinement by repeated procedure.
-- In single particle analyses, the images of protein particles are collected, and images similar in the directions of three-dimensional projection are superimposed and averaged. The averaging results in low-noise two-dimensional images. These images are used again as references for positioning the original images to obtain new averaged images.
After repeating these procedures, three-dimensional angles (Euler angles) are determined to construct a three-dimensional structure. In addition, a re-projected image is created from the initial three-dimensional structure. The image is subjected to averaging through the superposition of the original image as a reference to reconstruct a three-dimensional structure. These procedures are repeated until the structure is stabilized, in order to complete a structural model. In this training, the principles of single particle analyses and single particle analyses using Eos will be learned.